Optimize your daily decision making
Unlock Data-Driven Insights
Optimize your daily decision making
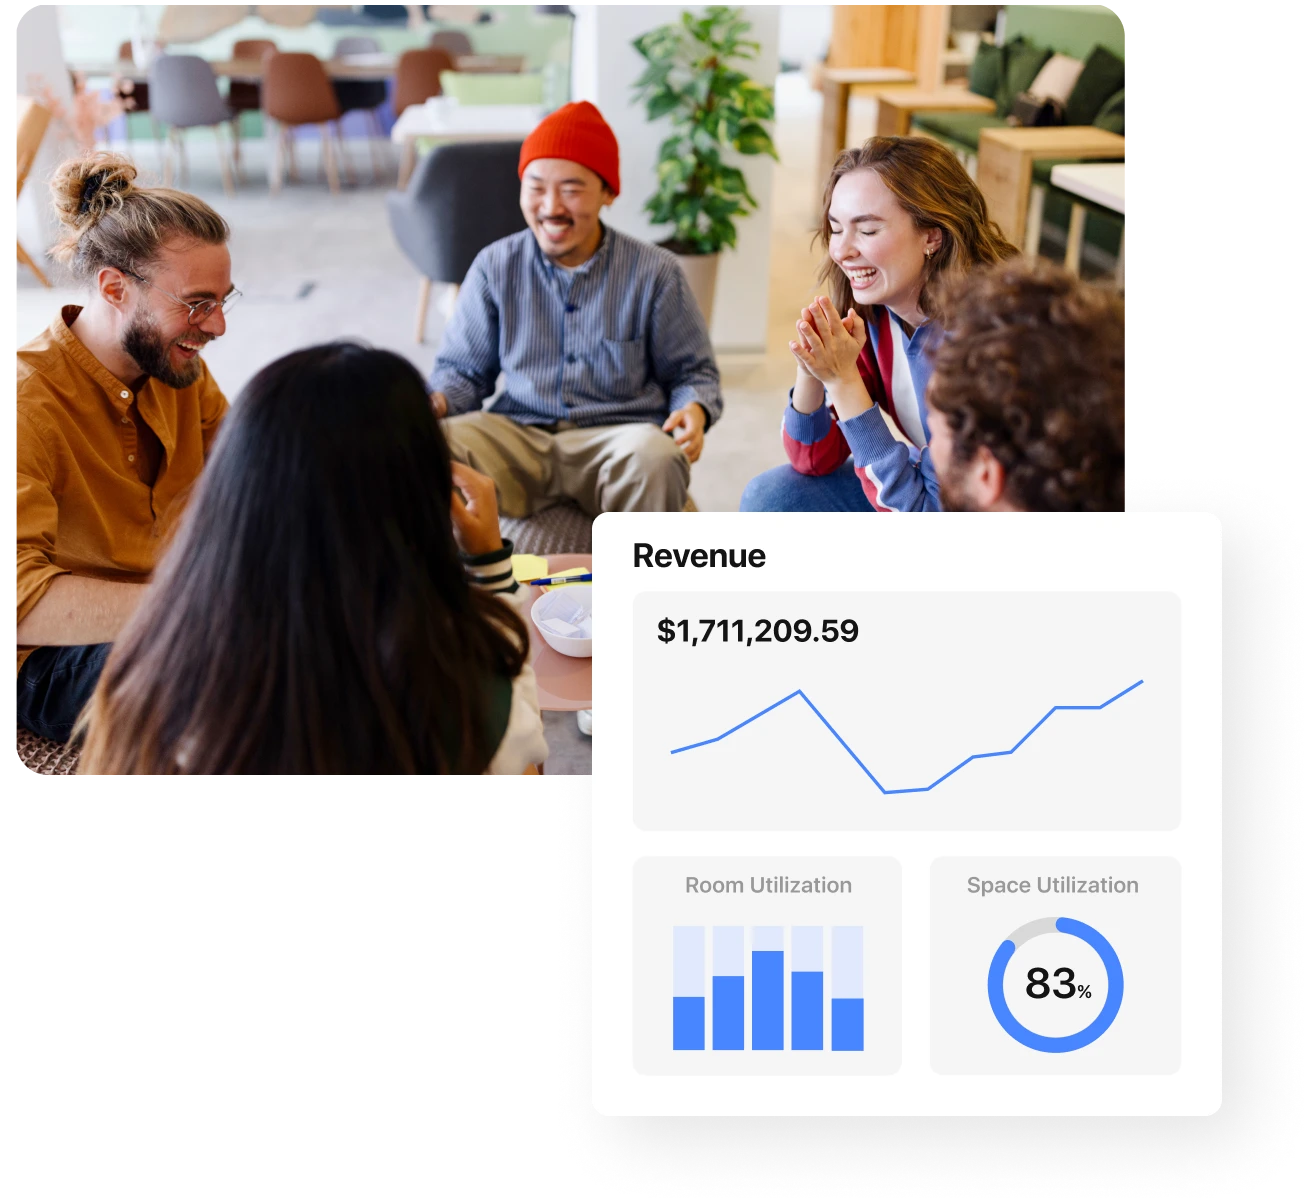
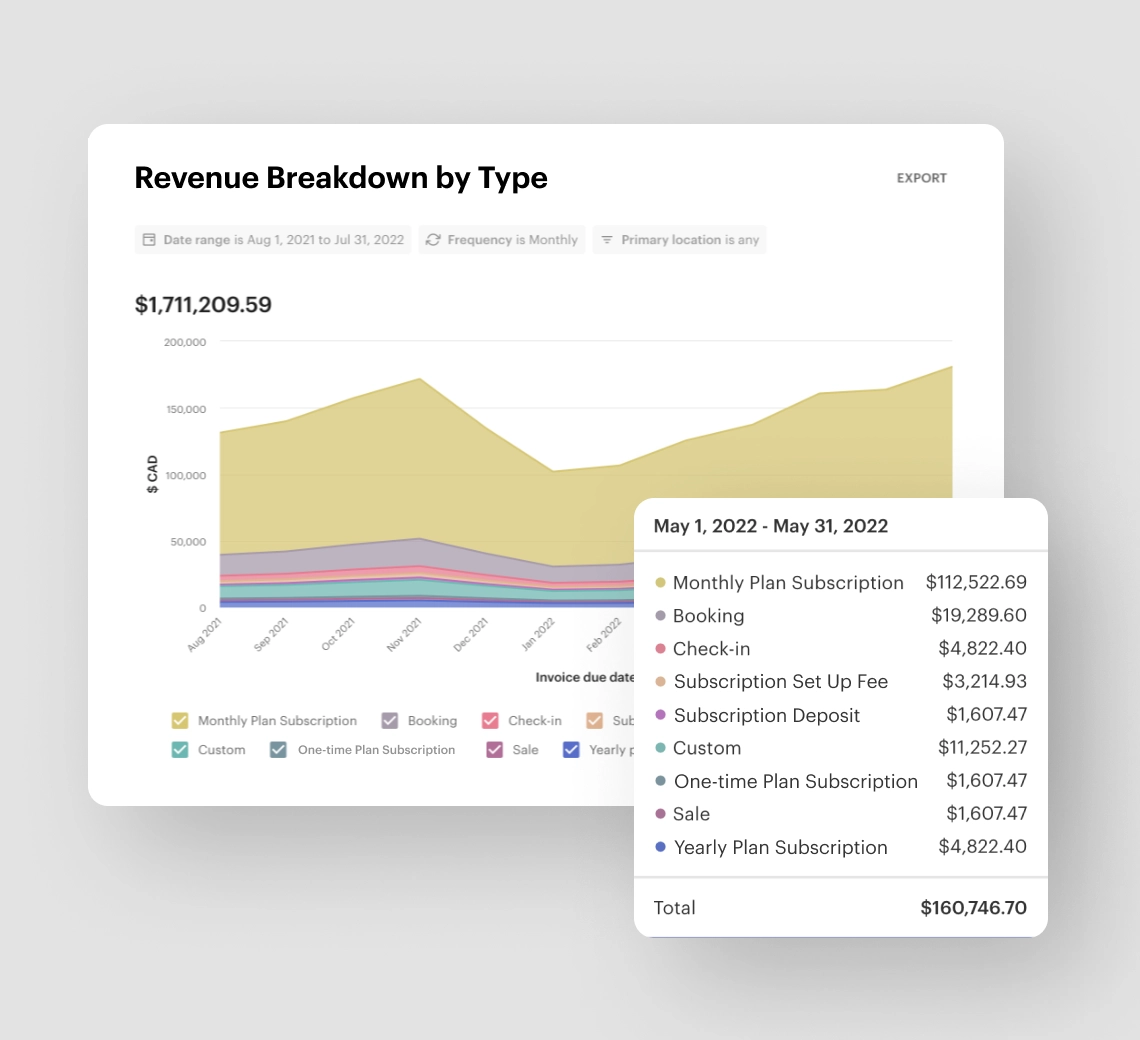
You need data to make decisions. Optix Analytics show you how your coworking business is performing across a variety of business verticals, all from a single dashboard.


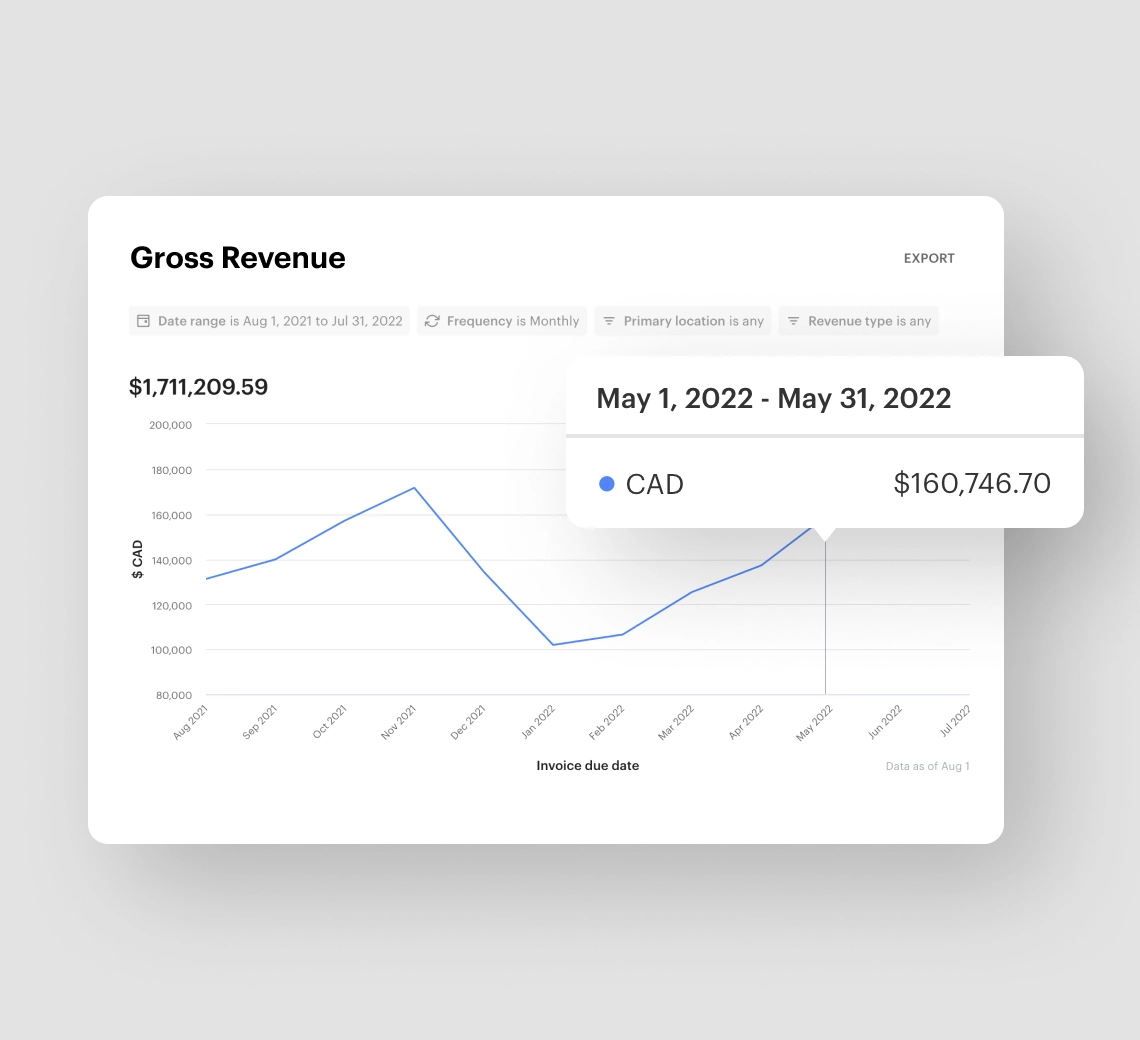
Use your own data to set realistic business KPIs for your coworking business. Custom filter your graphs to fit your needs. Track your success against your benchmarks over time.
No more guessing on how your business is doing – with Optix Analytics, you’ll always know.
Your business is evolving. Use the Analytics collected in Optix to better understand the needs of your users and improve your space over time. Trustworthy Analytics means you can remain agile and change as your business needs evolve.







Analytics can track member behavior by analyzing data such as space utilization, peak hours of occupancy, and member preferences. This information allows you to adapt your offerings based on member needs and improve the overall member experience.
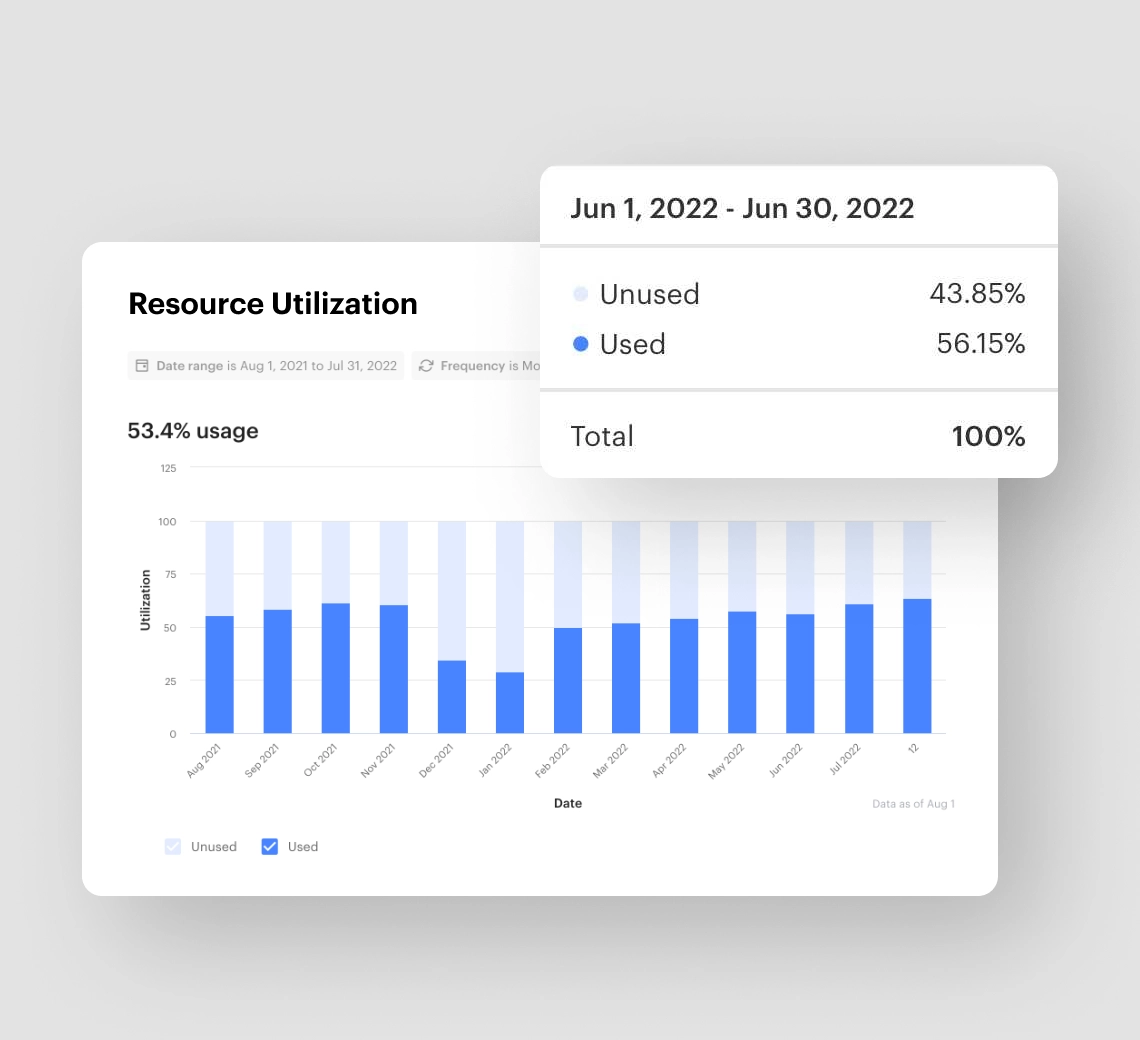
By analyzing usage patterns and occupancy rates, coworking software Analytics like that in Optix can identify underutilized spaces and peak usage times. This information enables you to optimize space allocation, improve facility layout, and enhance overall workspace efficiency.
Optix offers data on a number of different important and valuable metrics for coworking space owners and operators including gross revenue, active users, new plan subscriptions, account growth, average booking duration, check-ins, hours booked, and more.
Optix offers reports on all metrics mentioned above and more. For a full list of reports available in Optix, visit the Help Centre.
Optix reports on bookings alongside memberships and billing, so desk and room usage sits next to the revenue it produced rather than in a separate tool. Flex space managers see resource utilization, popular times and how usage shifts across locations.
Optix analytics carry a location filter that appears only for multi-location organizations, and the dashboard offers an all-locations-combined view that updates every widget at once. Revenue splits by location, every report exports to a spreadsheet, and figures refresh once daily.
Optix covers all three. Resource utilization shows occupancy against availability, revenue reports break down by plan, type and location, and member usage follows check-ins and account growth. Seventeen named reports export to a spreadsheet, refreshed once daily rather than live.
Optix reports on occupancy, revenue and member usage from one dashboard. You can forecast membership plan revenue by location, measure popular times with check-in heat maps and follow account growth over time, for a single site or across every location you run.