Introducing: New and Improved Analytics
What you need to know about the new and improved Analytics
December 3, 2020
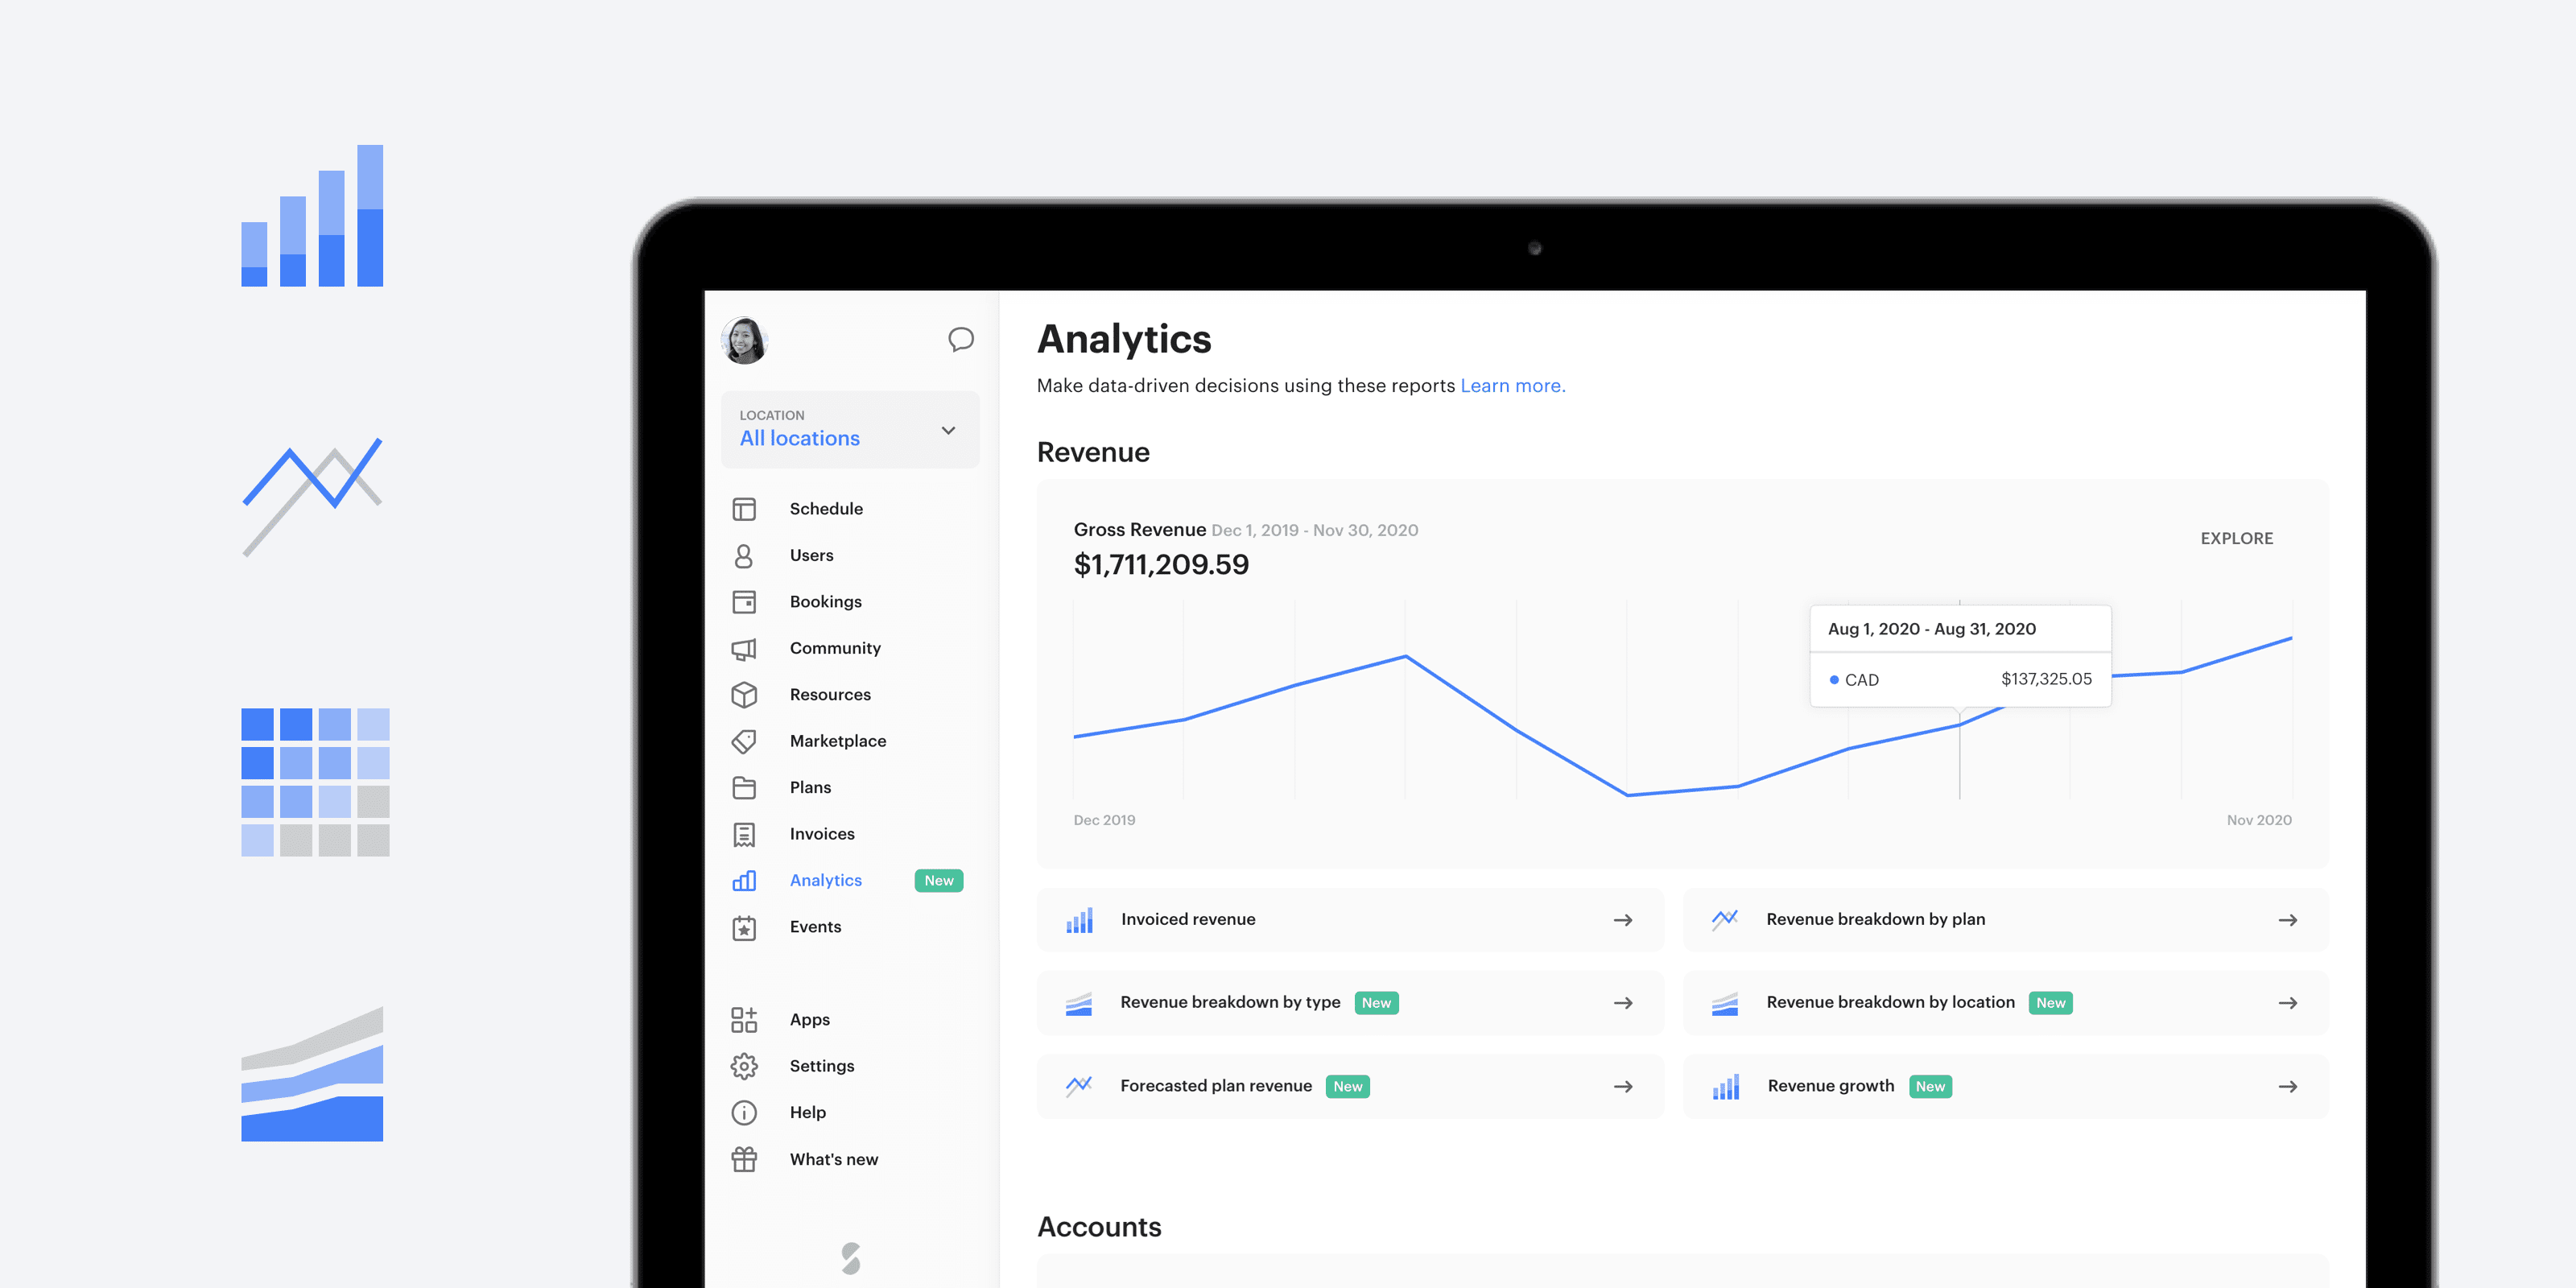
We’re happy to share the new and improved Analytics! The new Analytics page offers valuable data to help you optimize and scale your business. Now you can review detailed reports around revenue, accounts, activity, and the resources you have to offer. We’ve tried to visualize your data in the most simple and clear way possible, so that you can get to the data you need the most!
We’ve added some new charts to our roster of reports to provide you with further insights into your operations. We’ve also made the data easier to consume by adding in filters for each report and other tools to steer a more seamless experience. To learn more about how to use your new Analytics page, take a read through this FAQ.
There’s a long list of uses for these new analytics. Most importantly, you can use this data to set clear, actionable goals that you can then track and work towards. You could also present this data to your colleagues at your next quarterly review to showcase your growth and share why your coworking business is capable of expanding to multiple locations. Or, you can use the data to monitor your incoming revenue so you don’t miss any areas of opportunity for your business — so many possibilities!
Included below are the four categories of report types you can now access from the Analytics tab, with a quick explanation on the individual reports for each.
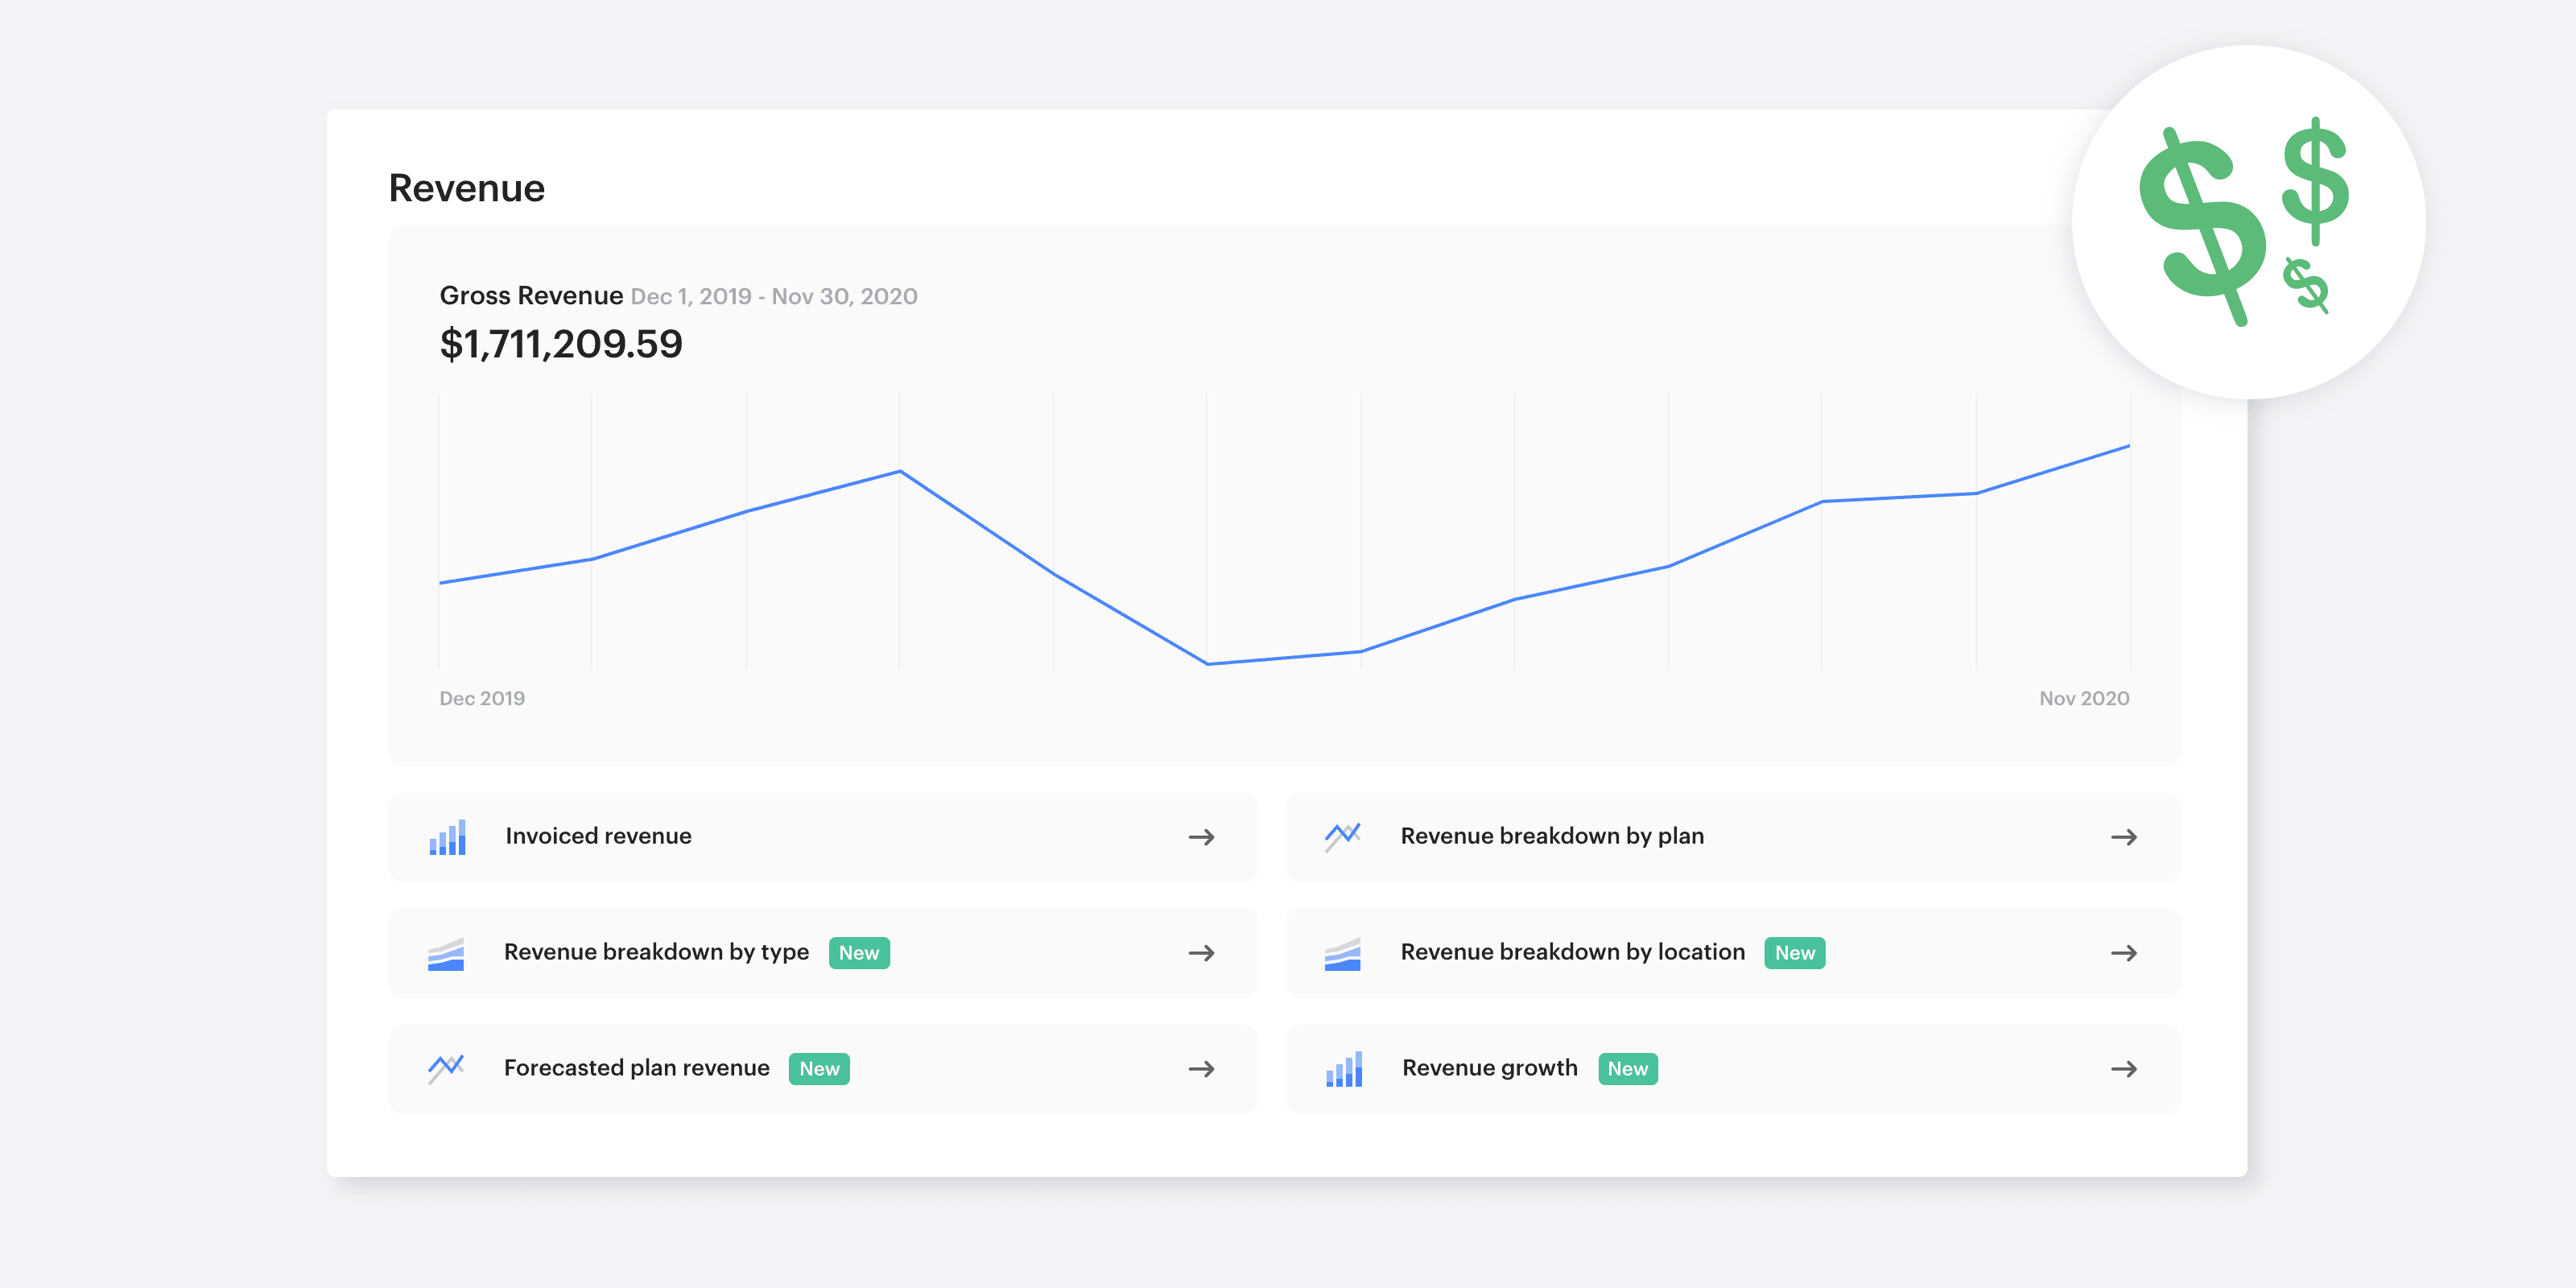
The new revenue reports showcase the incoming revenue at your organization, providing you an understanding of how your business is performing purely from a revenue perspective. You can see revenue from a variety of different sources; whether that be by a breakdown by plan, location, or type. You can also view a report by paid versus unpaid revenue. We even took it a step further by providing you a glimpse at your forecasted plan revenue. All of the reports allow you to see historical data and filter your report by a particular date range, all of which will be summarized in a user-friendly chart.
This revenue data allows you to keep an eye on your gross revenue, and see which avenues are providing you with the highest return. You can also use this data to get a closer look at which of your plans are outperforming others, and gear the rest of your plans to match the demand. Understanding the number of users subscribed to a plan can help determine if you need to market plans to your current users, or put more energy into your other revenue streams. And finally, get a better sense of the amount of users on any given plan, and the revenue each plan brings in. Who knows, maybe there are a few plans you can discontinue or combine with others to provide your users with more value.
There are a variety of revenue reports, including:
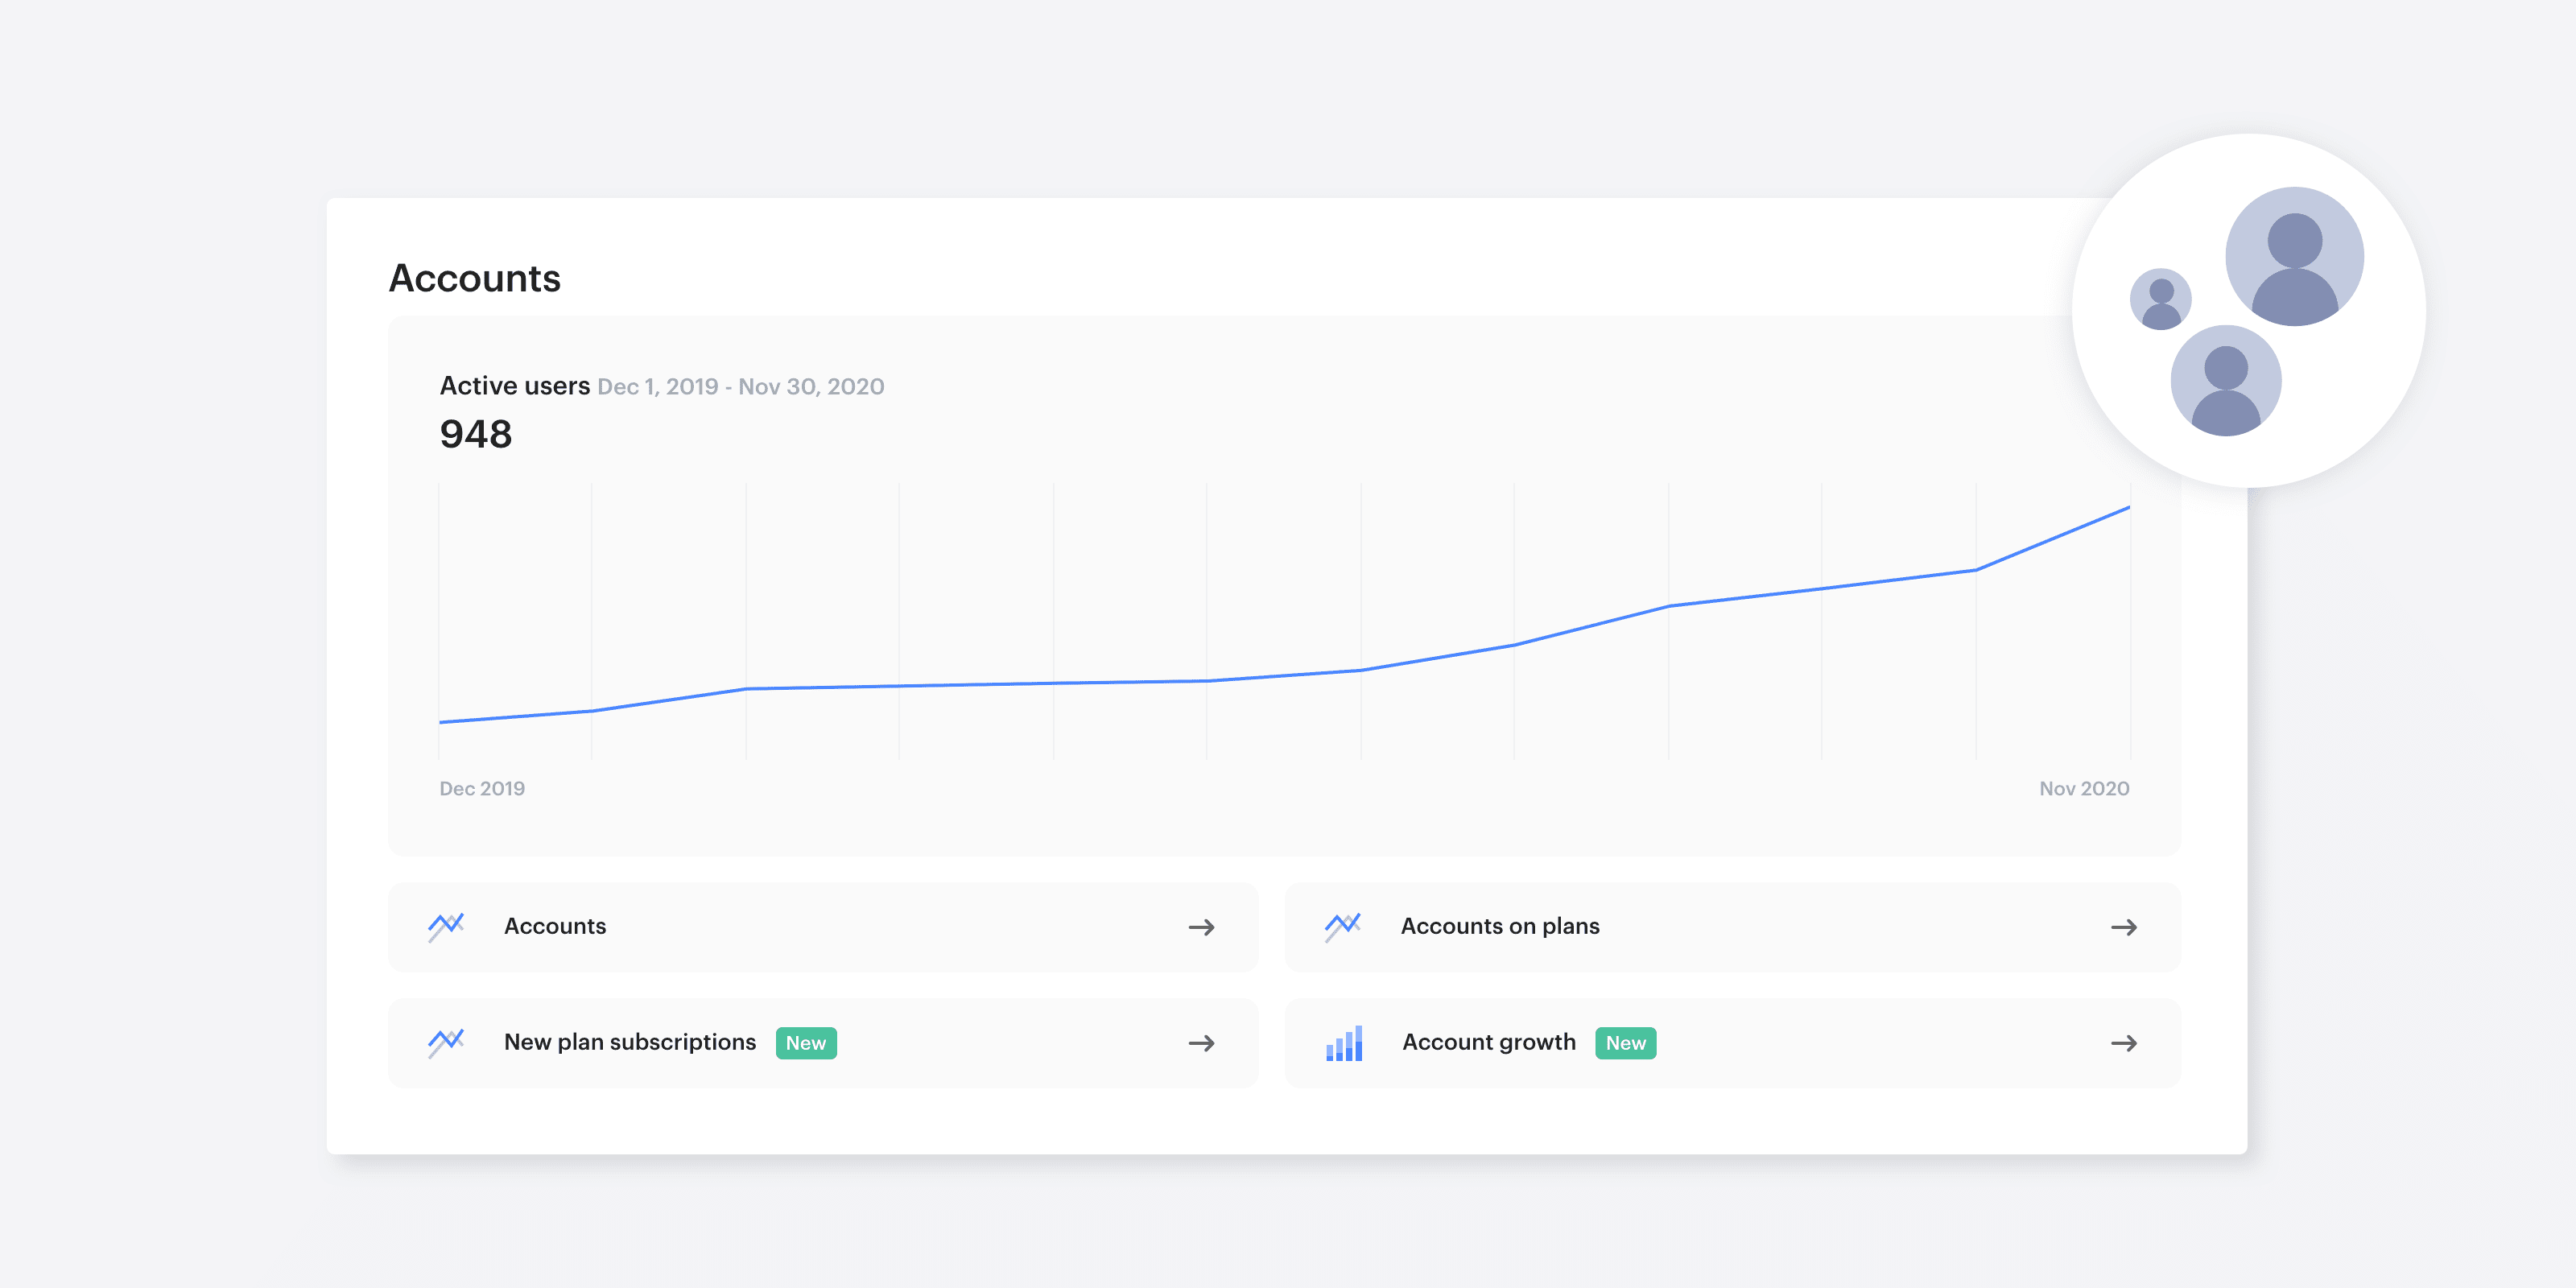
The accounts reports provide insights surrounding the individual accounts (users, teams, leads, etc.) at your organization. Are you hoping to grow your community in the new year? These reports are where you’ll be able to track the ups-and-downs of your user base. Here you can also get an overarching view of the total number of accounts at your organization. Get more granular by previewing the total number of accounts on active plans, the total number of new subscriptions, and more! There’s even an account growth report where you can see the growth of the accounts at your organization over time. This is a great resource for you to get a better sense of the demand for your business (is time to expand to an additional location?) and will allow you to work towards increasing sign ups at your organization and building up your user base.
The account reports included in this section are:
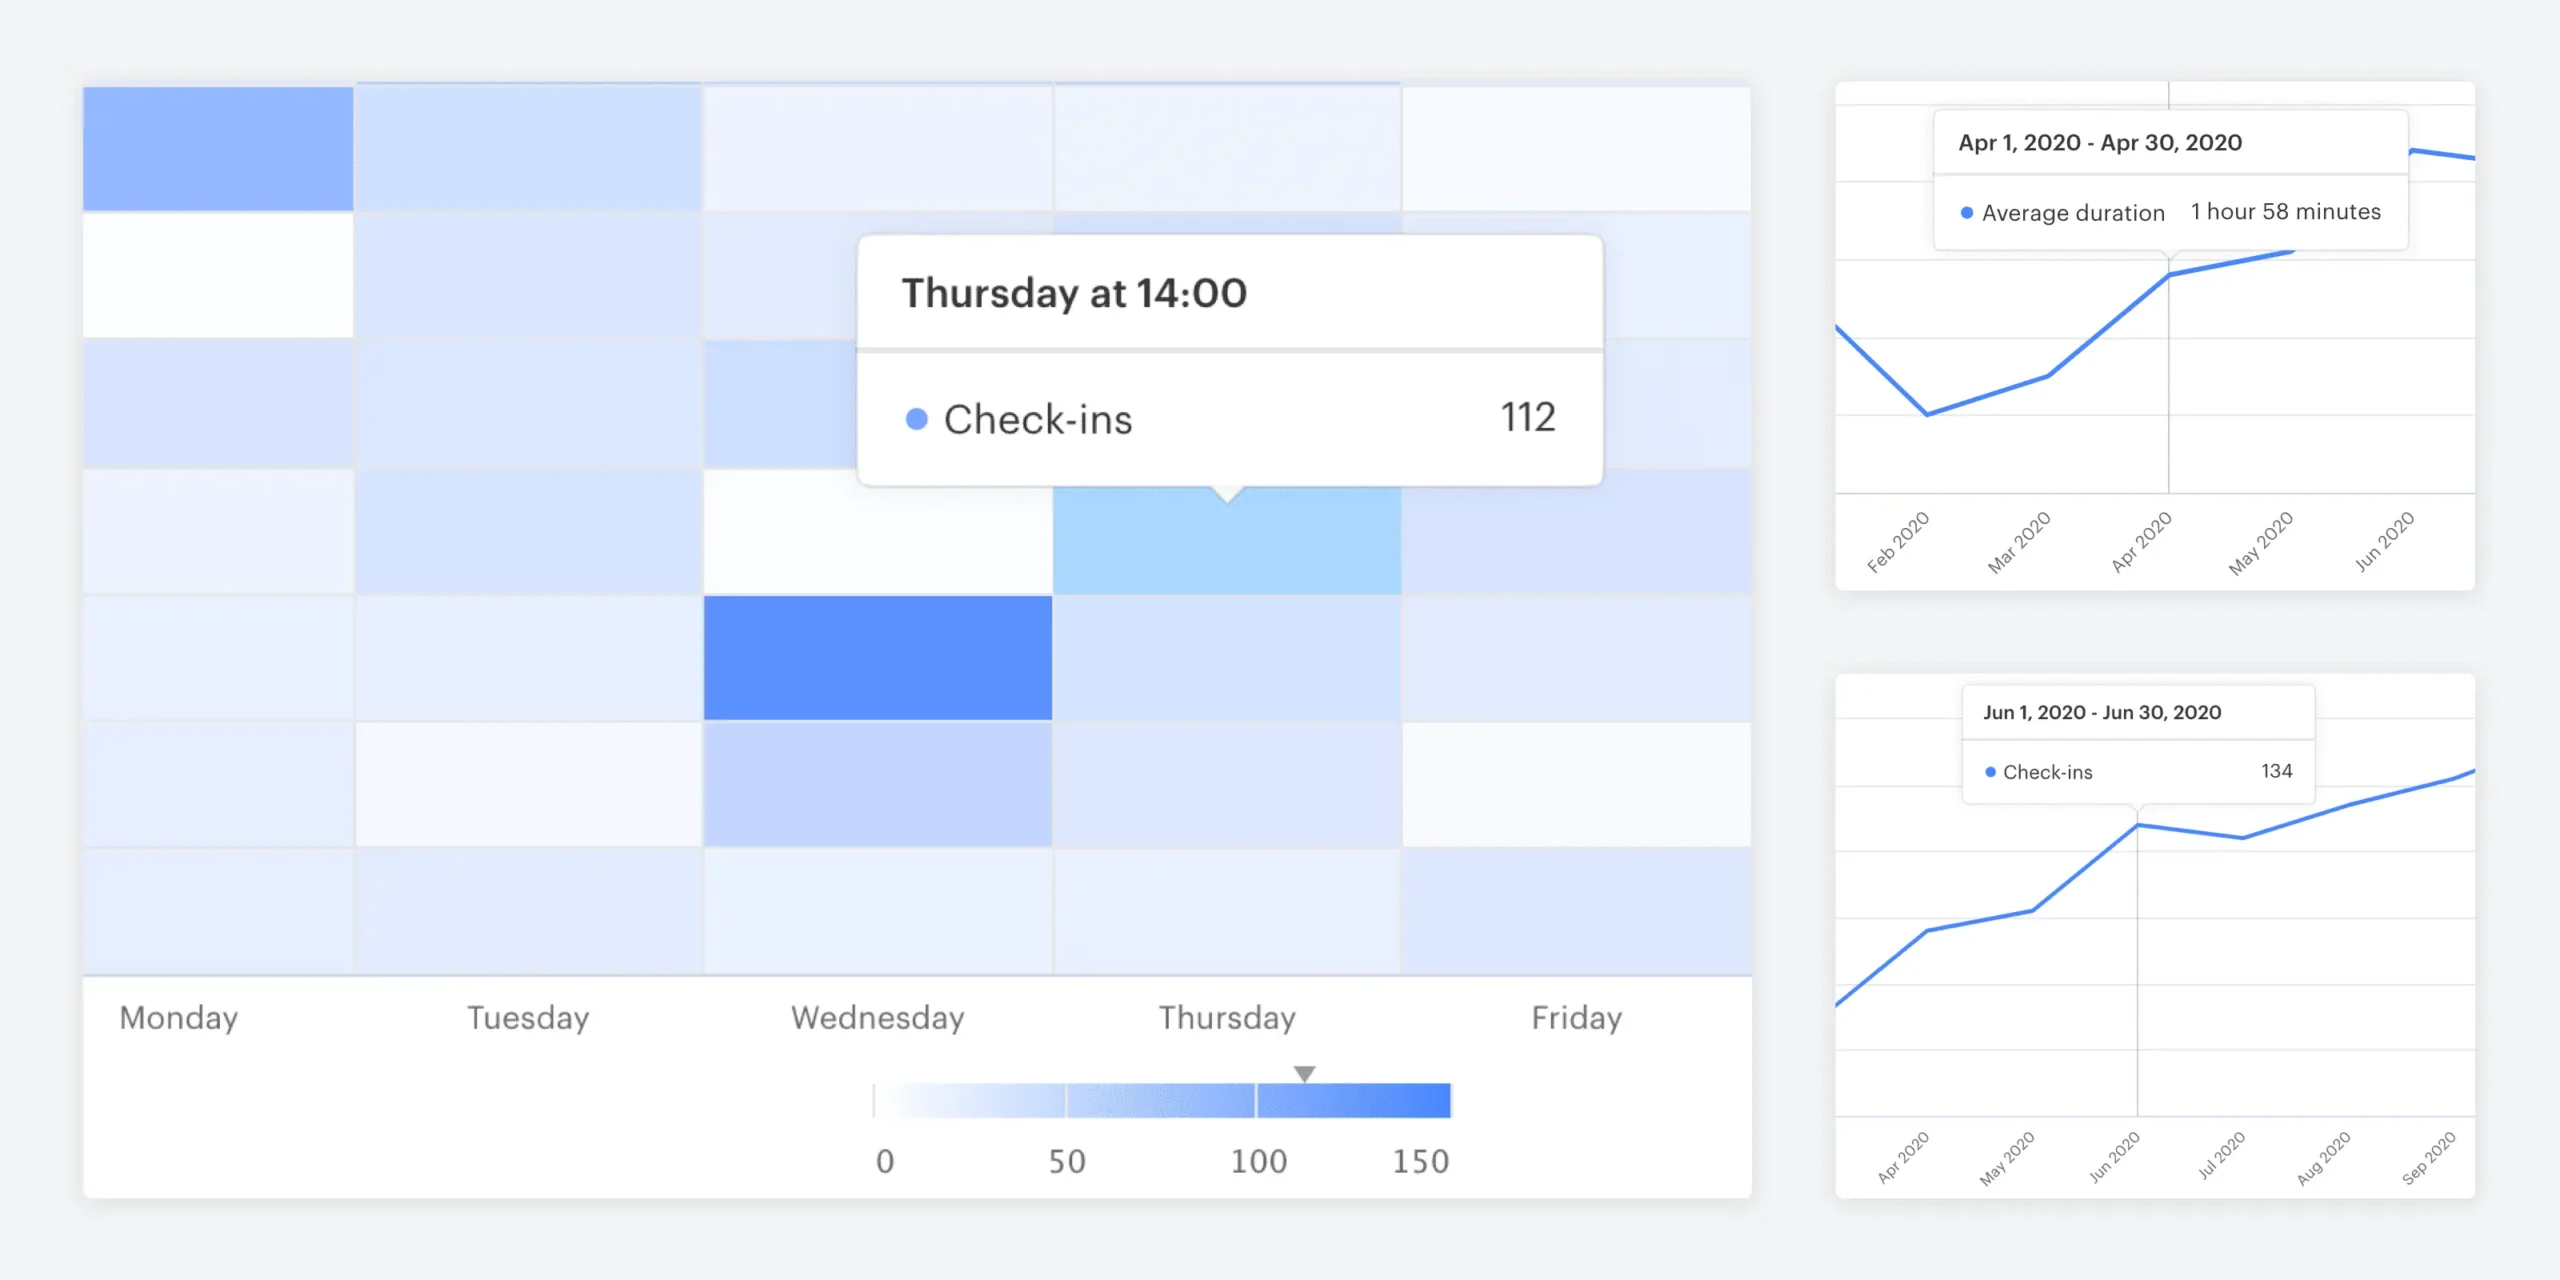
The activity reports showcase the busy nature of your booking and check-in activity. These reports share data regarding the average booking duration at your organization alongside a visual heatmap that provides numerical data around check-ins at particular times of the day. And finally, an all-inclusive report that includes numerical data around check-ins.
These reports are especially useful for you to familiarize yourself around when the busy times are for people checking in and how the average booking times at your organization.
A quick summary of the reports:
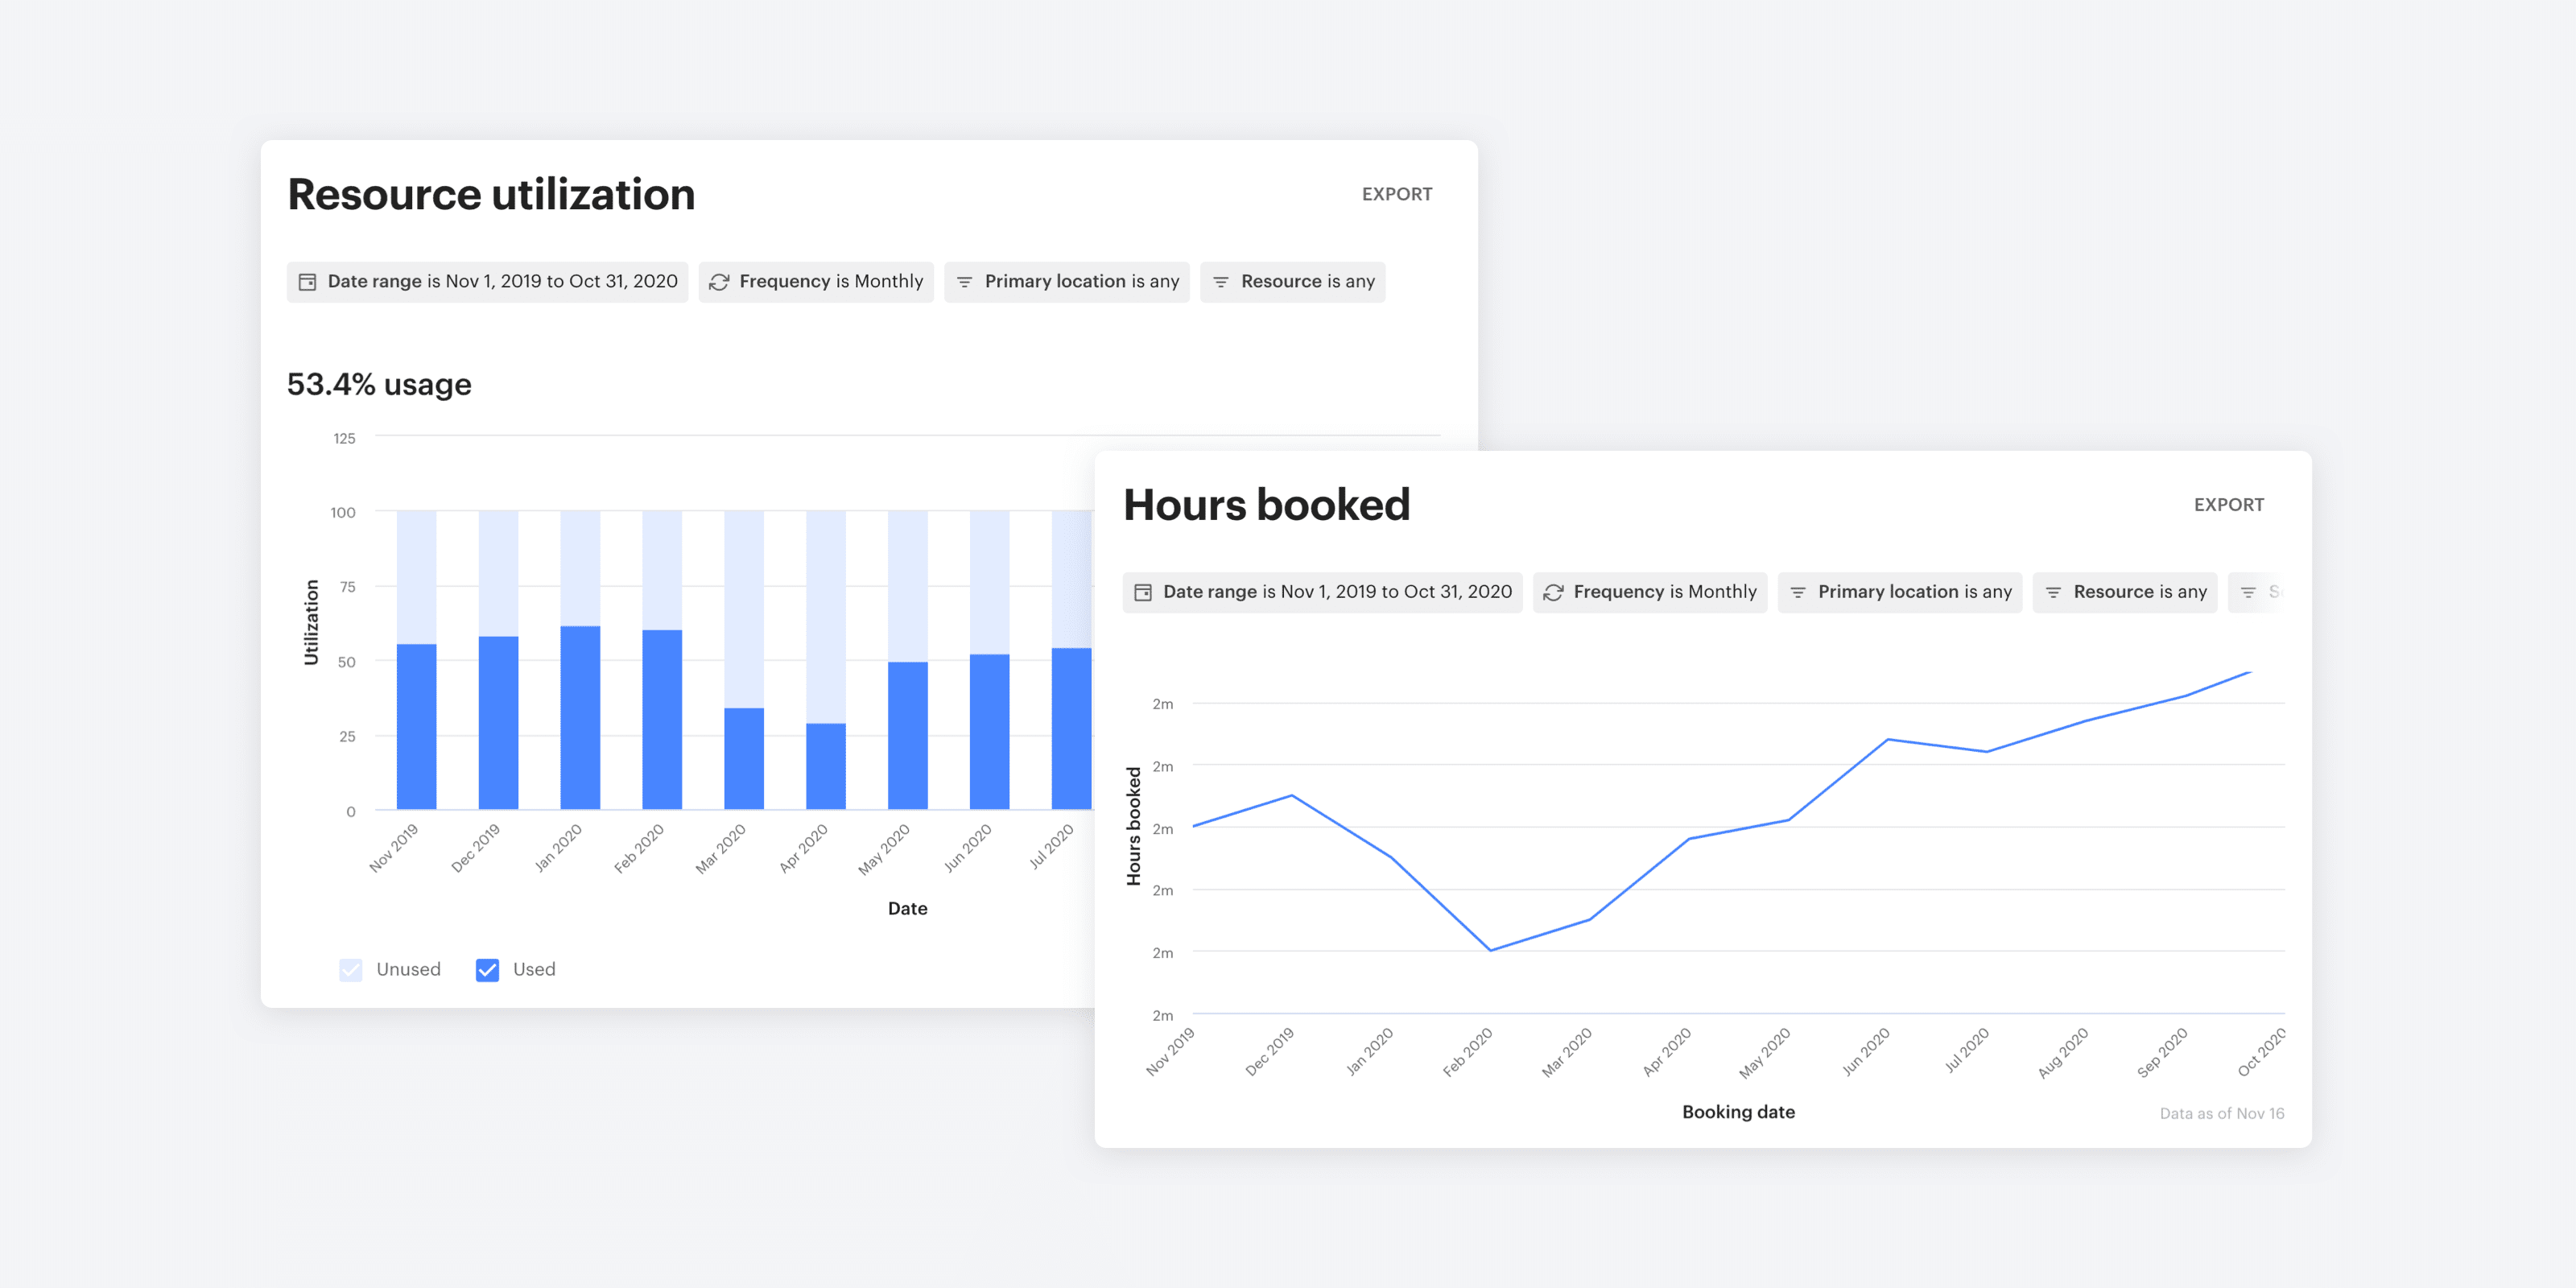
The resource reports provide you with intel about the resources offered at your organization. These reports effectuate your understanding of the utilization of your resources. See your utilization at a glance to track overall performance or look deeper to investigate the details. These reports will lead you to uncover any underperforming resources, leading you to discover why they’re underperforming in the first place. As well, you’ll be able to see which resources seem to be favorites, like the group of desks next to the windows.
What’s great about these insights is that they allow you to identify patterns and trends, ultimately leading you to uncover areas of opportunity for your business. With these resource reports, you’ll be able to understand the total time your resources were booked versus the time they were left available and sat empty. We’ve tried to make it easy for you to track the success of your efforts to make the most of your resources!
The two reports in this section include:
With our new and improved analytics, we’re hoping to enrich your team with valuable insights to help drive your business. Interested in learning more about the new Optix Analytics? Request a demo here.